Minnesota Secretary Of State - 2016 Election Statistics Maps
Skip to main content

2016 Election Statistics Maps


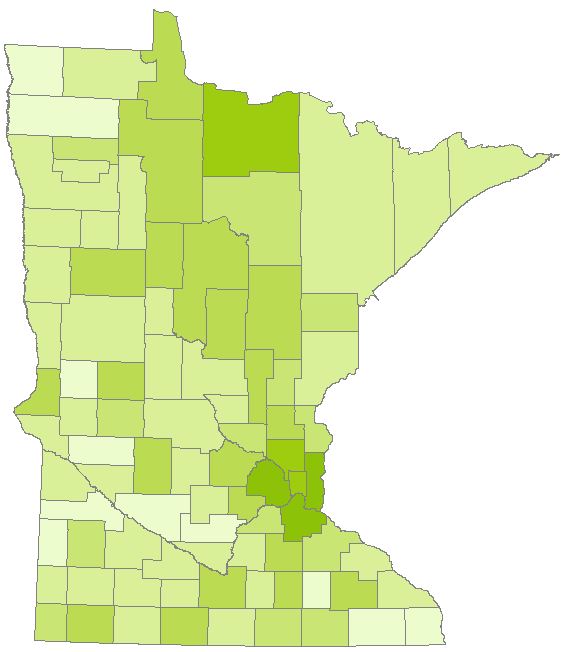
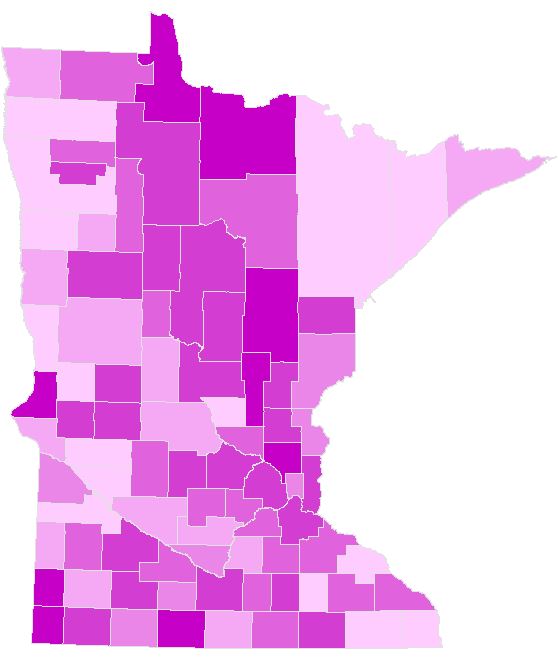
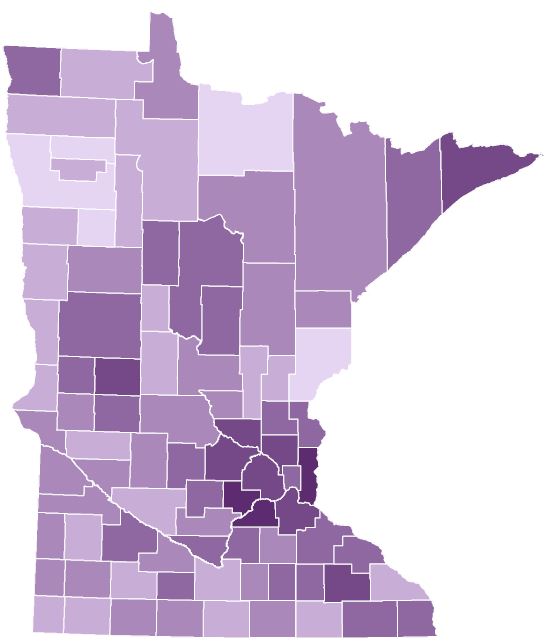
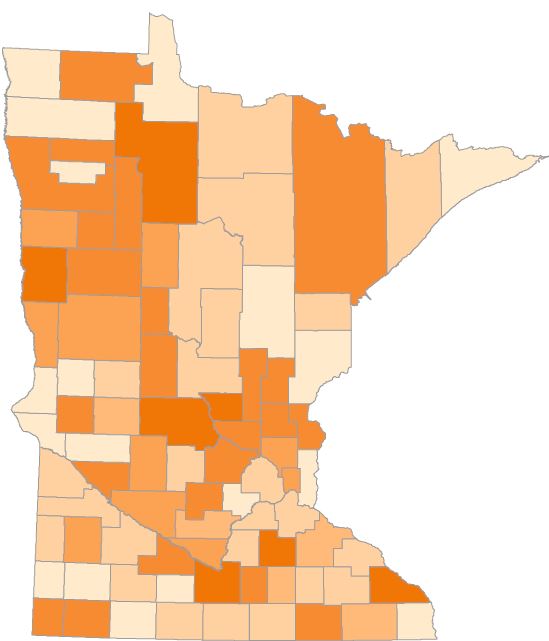
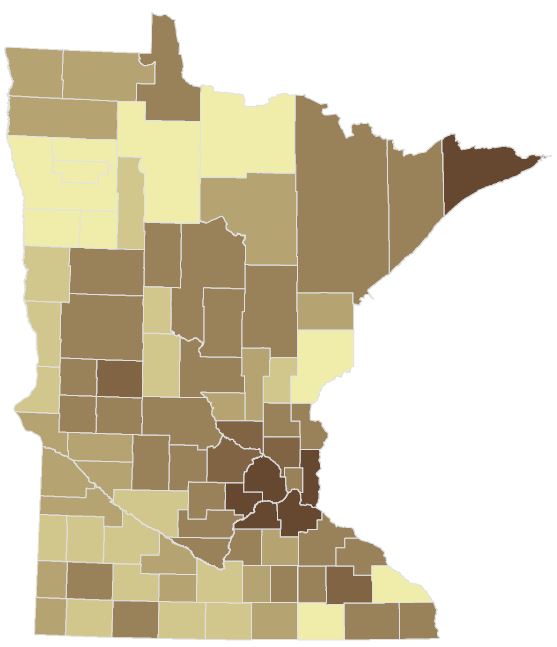
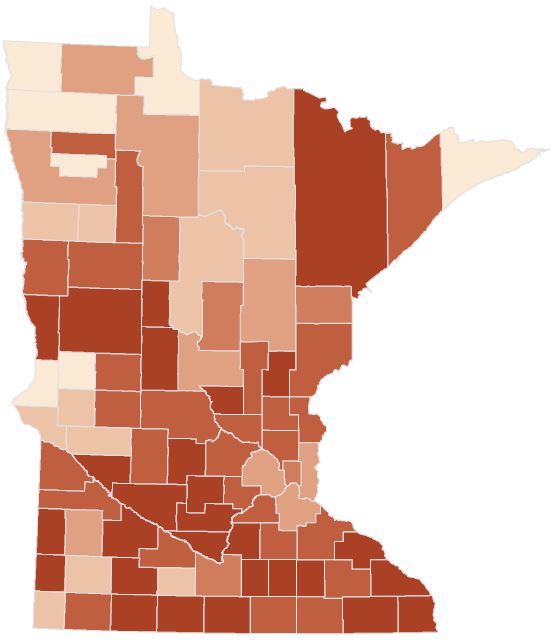
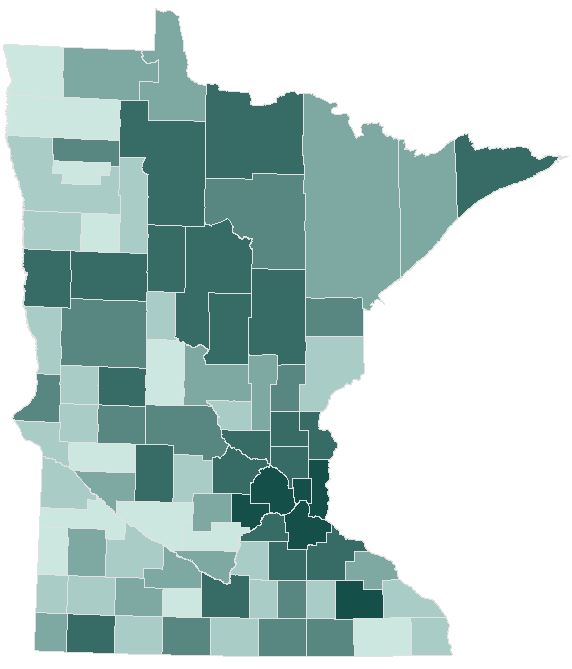
The maps on this page compare various statistics for the 2016 general election by county. Counties with higher percentage values are shown with darker colors. For more details, including numbers for each county, download a pdf map by clicking a map image or one of the links listed here:


Pre-Registration
Pre-registration by county. Counties with darker shades had a higher percentage of voters pre-registered
Election Day Registration
Election day registration by county. Counties with darker shades had a higher percentage of voters register when they voted
Voter Turnout
Voter turnout by county. Counties with darker shades had a higher turnout of estimated eligible voters.
Polling Place Voting
Polling place voting by county. Counties with darker shades had a higher percentage of voting via polling places on election day.
Absentee Voting
Absentee voting by county. Counties with darker shades had a larger percent of ballots cast via absentee voting.
Mail Voting
Mail voting by county. Counties with darker shades had a larger percent of ballots cast via mail ballots.
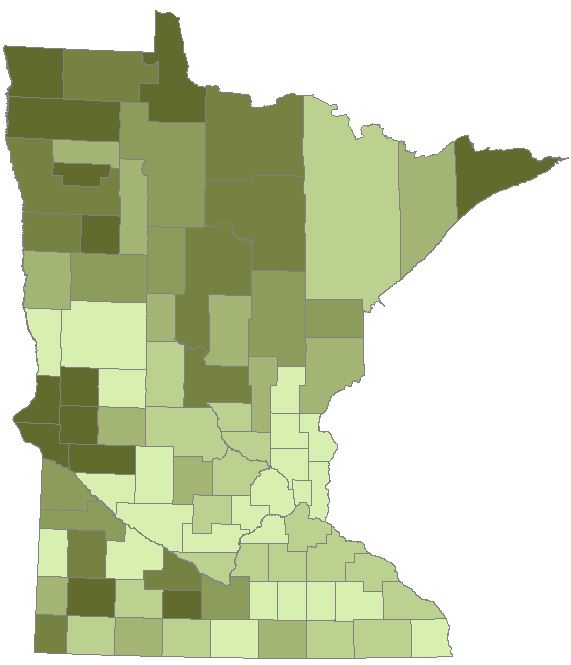
In-Person Absentee (Early Voting)
Early voting by county. Counties with darker shades had a larger percent of total voting cast via in-person absentee voting.
 
Early voting by county. Counties with darker shades had a larger percent of absentee votes cast via in-person absentee voting.